How JOIN Changed How We Approach Data Infra At NAVER
Authors:
Youngjin Kim Team Leader, NAVER ✉️ jini.kim@navercorp.com
Moweon Lee Data Engineer, NAVER ✉️ moweon.lee@navercorp.com
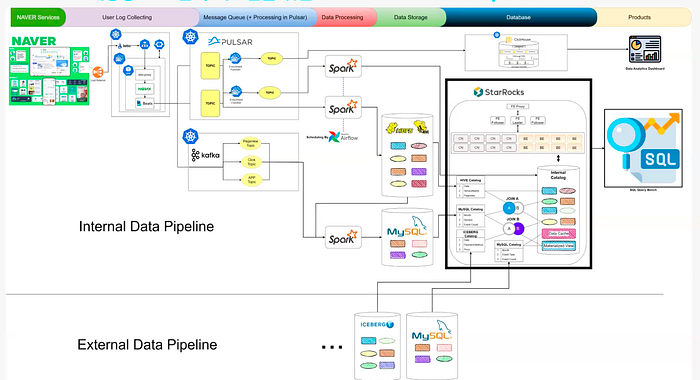
As the data platform team at NAVER, we power the analytics backbone behind South Korea’s leading web portal. NAVER supports an ecosystem of over 200 interconnected services, including search, e-commerce, media, and AI-driven applications. With most Koreans relying on our platform and accumulating 20+ PB of data in our Apache Iceberg Lakehouse, we handle some of the highest data traffic volumes in the country.
To deliver seamless user experiences and timely decision-making, our analytics system must provide real-time insights, process complex metrics, and scale effortlessly with ever-growing traffic. In this blog, we’ll share how we tackled these challenges, the strategies we implemented to enhance our analytics capabilities, and the transformative outcomes we’ve achieved along the way.
Powering Decision-Making at NAVER
At NAVER, our analytics system serves as a cornerstone for two key missions:
- Service Performance Monitoring: Ensuring our services operate efficiently and consistently meet user expectations.
- User Behavior Analysis: Gaining insights into how users interact with our services to drive data-informed decisions.

Our system is built to support internal stakeholders, such as engineers optimizing service performance or executives shaping strategy. To achieve this, we process and analyze vast amounts of log data, including user agents, service URLs, and clickstreams, transforming raw data into actionable insights that drive NAVER forward.
Challenges With ClickHouse
When we set out to build the first version of our analytics platform, we wanted to build something quickly, opting for ClickHouse as our initial solution. Its fast aggregated query performance allowed us to deliver results quickly in the early stages. However, as our platform evolved, we encountered significant limitations.
Fixed Dimensions
ClickHouse’s lack of JOIN support forced us to rely on denormalized tables, limiting users to fixed dimensions and hindering real-time analysis. With numerous data sources and tables, scaling was impractical, allowing us to serve only a fraction of our data.
Scalability Issues
Another major challenge was scaling ClickHouse. Balancing data across nodes required manual intervention, a time-consuming process that lacked automation. As data volumes grew, maintaining this balance became increasingly complex and resource-intensive.
Limited Data Upserts/Deletes
ClickHouse leverages merge on read to handle real-time mutable data. Although this could provide data freshness, it severely degrades performance, which was unacceptable. This limitation made many scenarios difficult, if not impossible, to support: it restricted our ability to support analytics workflows requiring mutable data and complex schemas.
As our analytics needs expanded to include dynamic dimensions, raw data queries, and seamless scalability, these limitations became more apparent, and it became clear that we needed a more robust and versatile solution to power NAVER’s analytics platform.
Options Considered — Trino, Pinot, Druid, StarRocks
We evaluated and benchmarked several leading solutions that could potentially address our challenges: Trino, Pinot, Druid, and StarRocks against the following criteria:
- Multi-Table JOINs: The ability to handle complex queries across multiple tables without relying on denormalization.
- On-the-Fly Aggregated Query Performance: Ensuring fast and efficient query execution for dynamic, real-time analysis.
- Scaling Capabilities: Seamlessly scaling horizontally to handle growing data volumes with minimal operational overhead.
- Data Upserts: The ability to support real-time data upserts without impacting query performance.
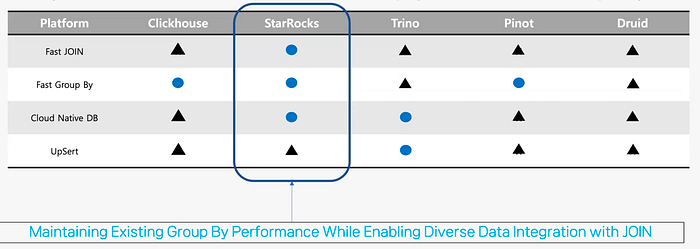
After extensive testing, we selected StarRocks for the following reasons:
- Out-of-the-Box Multi-Table Queries: StarRocks natively supports complex multi-table JOINs, eliminating the need for denormalized tables.
- Federated Analytics: Integration with Apache Iceberg and other open formats enables seamless analysis of our internal and external datasets, providing a unified query interface with great flexibility.
- Superior Aggregated Query Performance: StarRocks matched or exceeded ClickHouse’s performance for aggregated queries, even with dynamic workloads.
- Cloud-Native Scalability: Its decoupled storage-compute architecture simplifies scaling, allowing shared data across nodes and efficient resource management.
StarRocks emerged as the ideal platform for our evolving needs. It enables us to build a robust, scalable, high-performance analytics system for NAVER.
Migrating To StarRocks
We conducted comprehensive tests using our real-world queries and datasets to identify the optimal resource allocation and verify StarRocks’ performance capabilities. The tests included multi-column aggregated queries, multi-table JOIN queries, and horizontal scalability.
Testing Performance & Resource Allocation
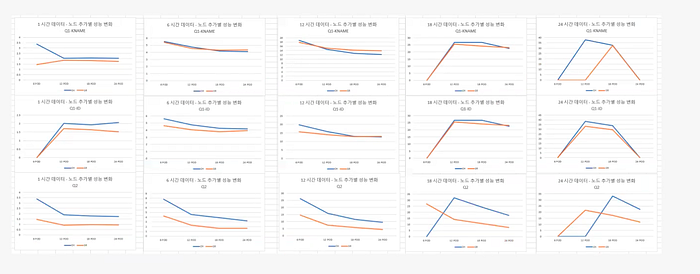
To determine the optimal resource allocation, we tested StarRocks’ performance with our queries and data and compared it to ClickHouse on our 1-hour, 6-hour, 12-hour, 18-hour, and 24-hour data.
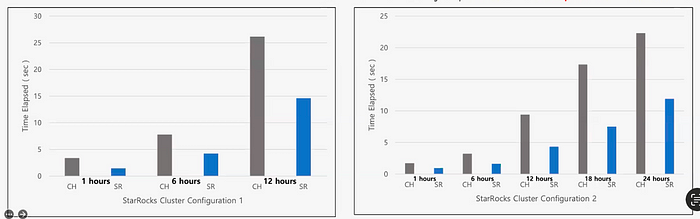
Multi-column aggregated queries
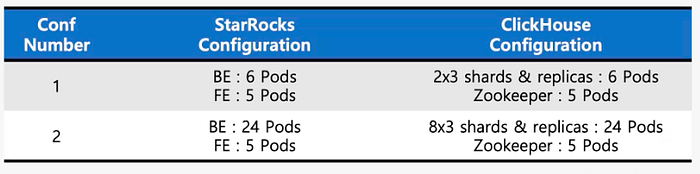
The first benchmark focused on multi-column GROUP BY queries. We evaluated StarRocks and ClickHouse under two configurations: small and large clusters on Kubernetes. StarRocks consistently outperformed ClickHouse across both configurations.
JOIN queries
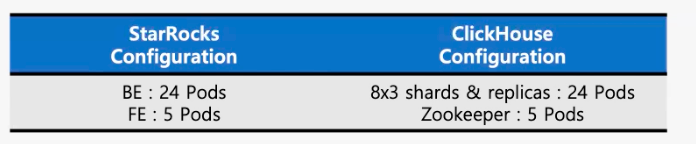
Next, we tested StarRocks and ClickHouse’s ability to handle multi-table JOIN operations using the above cluster configurations.
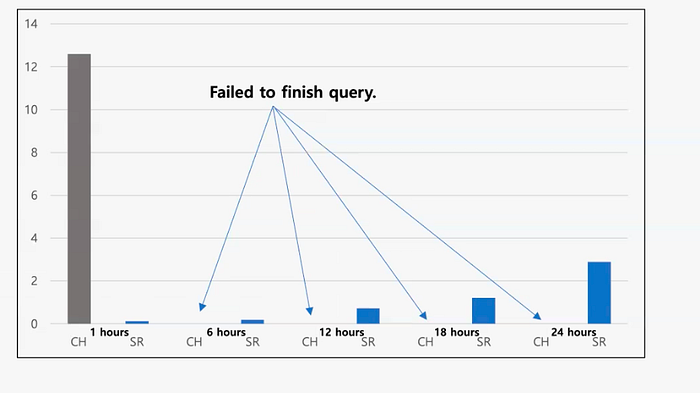
StarRocks completed all JOIN queries with excellent latency. In contrast, ClickHouse failed to finish four out of the five queries.
Horizontal scalability
Our infrastructure is fully containerized and runs on Kubernetes (Kubernetes), making horizontal scalability a crucial factor in ensuring consistent performance and optimizing costs.
Below is a comparison chart illustrating how StarRocks and ClickHouse behave when scaling in and out:
From the chart, it’s clear that StarRocks exhibits linear growth as additional resources are allocated. This scalability allows us to handle increasing workloads efficiently while maintaining predictable performance.
Resource Allocation
Our StarRocks infrastructure was optimized based on the testing results. It included:
- 5 Frontend (FE) Pods: Responsible for query parsing, planning, and coordination to ensure efficient execution.
- 80 Backend (BE) Pods: Dedicated to data storage, with each pod equipped with 48 CPUs, 50Gi of RAM, and 10TB of SSD storage. This configuration ensures fast and reliable data access.
- 70 Stateless Compute Node (CN) Pods: Dynamically allocated to scale compute resources as needed, with each pod provisioned with 48 CPUs and 50Gi of RAM to handle high query volumes and complex analytics workloads.
Setting Up Monitoring
Monitoring is a critical component of maintaining the reliability and performance of our analytics platform. With StarRocks, setting up monitoring was streamlined using the pre-configured Grafana templates provided in the StarRocks documentation.
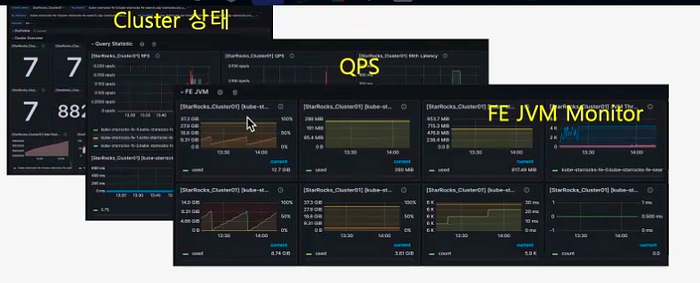
The template includes an installation guide and pre-defined dashboards to monitor metrics such as cluster status, compaction status, and BE and FE statuses. These metrics allow us to monitor the system’s health and performance in real-time, enabling proactive maintenance and quick issue resolution.
Further Accelerating Queries With Materialized Views
To further enhance query performance, we utilize StarRocks’ materialized views. These MVs act as an intermediate cache for the base tables, accelerating query execution without requiring manual maintenance.
Key features of materialized views in StarRocks include:
- Query Rewrite: Automatically optimizes queries to use materialized views when applicable, reducing the need to rewrite SQLs manually.
- Auto/Scheduled Refresh: Keeps the views up to date with minimal manual intervention, ensuring data consistency.
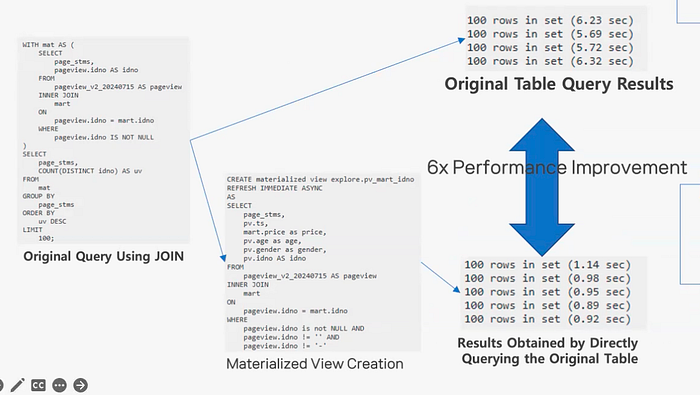
For the query above, we created a denormalized materialized view (MV) to bypass the JOIN operation, resulting in a 6x performance improvement. The best part? These MVs can be added on demand, and thanks to StarRocks’ query rewrite capability, there’s no need to modify the original SQL. This flexibility allows us to optimize query performance effortlessly at any time while maintaining simplicity in our workflows.
Results from the Migration
The transition to StarRocks has delivered transformative improvements across our analytics platform:
- Flexible Interactive Queries Engineers can now directly query raw data using SQL, providing unparalleled flexibility compared to ClickHouse’s rigid, pre-defined metrics.
- Enhanced Performance for All Data Multi-table JOINs and multi-column
GROUP BYqueries execute significantly faster, even with datasets that include real-time data upserts and deletes. - Unified Query Platform StarRocks powers a unified query interface using the StarRocks internal catalog for high-performance queries, the Apache Iceberg external catalog for governed external data, and the Apache Hive external catalog for legacy siloed datasets. This enables seamless, efficient, and consolidated analytics across all data sources.
- Scalability StarRocks’ horizontal scaling capability with Kubernetes ensures linear growth in processing power, allowing the platform to handle dynamic and heterogeneous workloads cost-effectively.
These benefits have streamlined our workflows and positioned our platform to support NAVER’s evolving analytics needs more efficiently and flexibly.
Future Plans
We aim further to enhance our StarRocks deployment with the following plans:
- Performance Optimization: Refining partitioning strategies to improve query efficiency, particularly for timestamp-based queries, to deliver even faster analytics.
- Community Contributions: Contributing our internal advancements to the open-source community, helping to strengthen StarRocks’ capabilities for a broader audience.
- Broader Integration: Expanding StarRocks’ role to handle more external datasets, leveraging Apache Iceberg for dynamic and governed data queries.
At NAVER, the ability to efficiently handle multi-table JOINs has been a game-changer for our analytics platform. StarRocks has empowered us to overcome previous limitations, enabling faster query performance, seamless scalability, and a unified query platform that integrates with our diverse data sources. These improvements have allowed us to deliver real-time insights and support data-driven decisions across our entire ecosystem.
Curious to learn more about how StarRocks handles complex JOINs and other analytics challenges? Join the StarRocks Slack community to connect with us and explore further!

